When transactions fail, it is not always possible to determine the root cause. Therefore, several tools have been put into place to assist users and technicians in determining the area where the problem is occurring.
Transaction Dump Capture
The first place to look when troubleshooting issues is the actual transaction and response to the transaction. Users can turn on a feature in the ESM service that dumps every transaction request and response to a flat file (XML). This capability requires a pre-existing directory on the Online Server in the root directory called ESM_Traces. This is the location in which the transaction requests and responses will be dumped.
The naming conventions are as follows: each transaction request and response are named with the actual transaction ID, which ESM includes in each transaction.
The transaction request and response files represent the actual transaction that was received by the ESM service and the actual response returned. Therefore, anyone troubleshooting issues can review the trace files for transactions and determine exactly what was sent by Easy Purchase and received by the ESM services. Likewise, responses can be reviewed for the exact content sent back to ESM.
In addition, this same transaction requests can be loaded directly into the ESM Test Console on the online server and executed against the ESM Service and Controller multiple times while troubleshooting an issue.
Purchasing Subsystem Tracing
The purchasing ESM Controller was implemented with a whole range of tracing built into it. While the ability to dump the transaction requests and responses to file is a great place to start troubleshooting, sometimes it is necessary to see what is going on under the hood to determine what exact paths the ESM controller is taking for the request and what decisions and/or error processing is occurring in the ESM controller.
The user can turn on tracing in the ESM controller and see what processing is taking place. Follow the below steps to turn on and off tracing in the ESM controller. Please note that tracing must be turned on for the server that the ESM controller is running on, which would be the BusinessPlus 7i Web Server defined in the XML settings document that resides on the Online Server.
-
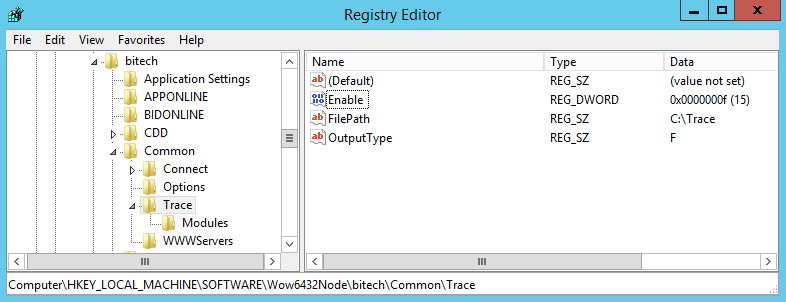
Go into the registry for BusinessPlus and turn on tracing for the BT30PO.Managed project. This involves turning on the tracing-enabled flag as seen below. Setting the value to hex f (decimal 15) turns on all tracing levels (info, verbose, warning, fatal).

-
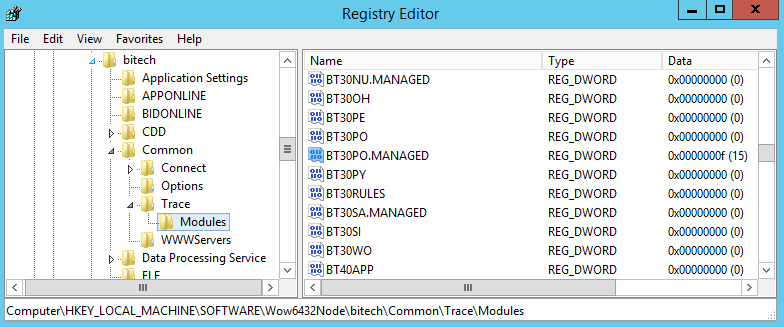
Go into the Modules subdirectory and set the registry setting for the BT30PO.Managed project. It is only necessary to turn on that one project since that is where the ESM controller lives.

-
The last step in turning on trace is to recycle the 7i Data Processing service. At this point, the user performing the troubleshooting can duplicate the problem using either direct transactions from Easy Purchase or running the problematic transaction request from the ESM Test Console. After running the traces against the problem, the trace file can be reviewed and sent to PowerSchool Help Desk for review. The trace dump file will be located on the BusinessPlus 7i Web Server in the directory defined in the registry for tracing in the File Path key as seen above.
-
Once tracing is complete, the user should always turn tracing back off. This is because extreme tracing can ultimately affect 7i and workflow processing services and should not be used unless necessary. It should never be left on unless the tracing is to continue over several days.
-
To turn off tracing, reset the two registry settings to "0." Likewise, it will be necessary to recycle services after turning it off.
ESM Service Test Console
A test platform has been included in the ESM Service. The test console is located on the client's online server as a separate application.
If no short cut is found on the desktop, the ESM Test Console can be found in the Services directory under eSchoolMall. The executable can be launched from there, or a short cut can be created for the desktop as explained in the installation section of this document.
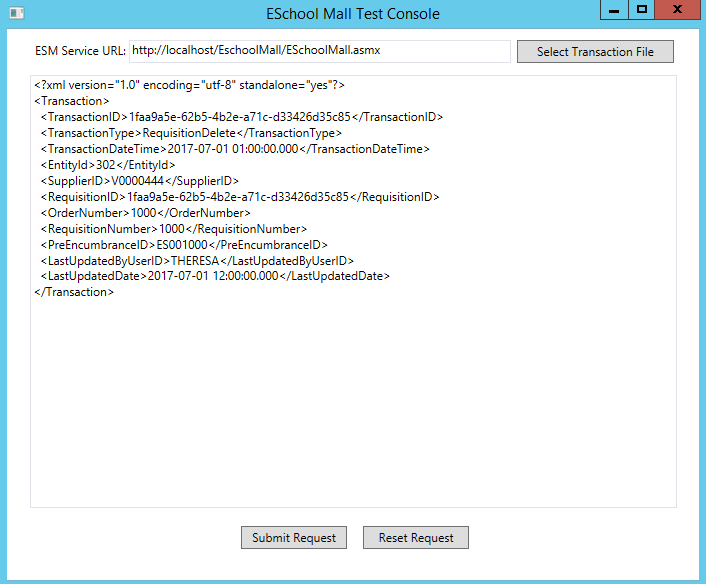
When the application is executed, the ESM Service Test Console is displayed as follows:

The ESM Service Test Console allows users to create new requests by loading one of the transaction templates into the Text Editor and filling it out with site-specific information. Likewise, the user can locate a dumped ESM Transaction Request from the ESM_Traces directory and execute it.
Select Transaction File – Clicking this button displays the "Open File" dialog box. The user can select from a transaction template in the test console directory. They can also use an existing transaction that was sent by ESM to the client's Online server if the ESM Settings file is set to dump ESM transaction request or response files to a directory. The dump file capability is set in the ESM Settings file and is referenced by the interface. If set, each ESM transaction is dumped to a predefined ESM_Traces directory on the server hosting the service. The following is an example of the ESM Settings file with the debug node set to "CAPTURE."

ESM Service URL – This field will be populated with the URL of the target ESM Service that the ESM Test Console is connecting to.
Submit Request – Once the template has been populated correctly or the existing transaction loaded into the text editor, the user can click the Submit button to submit the transaction request to the ESM Service. The request will be validated and processed. The response to the ESM service will be displayed on the test console upon completion of processing. This will either be a Success or Error response, depending upon the results.
Reset Request – Clicking this button will reset the form. The user can then use another transaction template or existing request.
